Worksheet 4
This week, we examine the mechanisms that allow the operating system to retain control of the CPU: how a program requests a kernel service (a system call), how an external event transfers control to the kernel (an interrupt), and how execution moves from one process to another (a context switch). Read the worksheet, complete the three walkthroughs, and use the self-check at the end to prepare for the Oct. 7 quiz.

Part 0Watch the lecture first
Watch: Exceptions, System Calls & Context SwitchPart 1Fault isolation and protection from malicious processes
$ ./buggy-c-program
Segmentation fault (core dumped)
$ echo $?
139
Have you ever run a C program and received Segmentation fault? The message is frustrating, but your computer is still running because only one process failed.
Without this isolation, every bug could stop the entire computer and produce a blue screen or kernel panic.
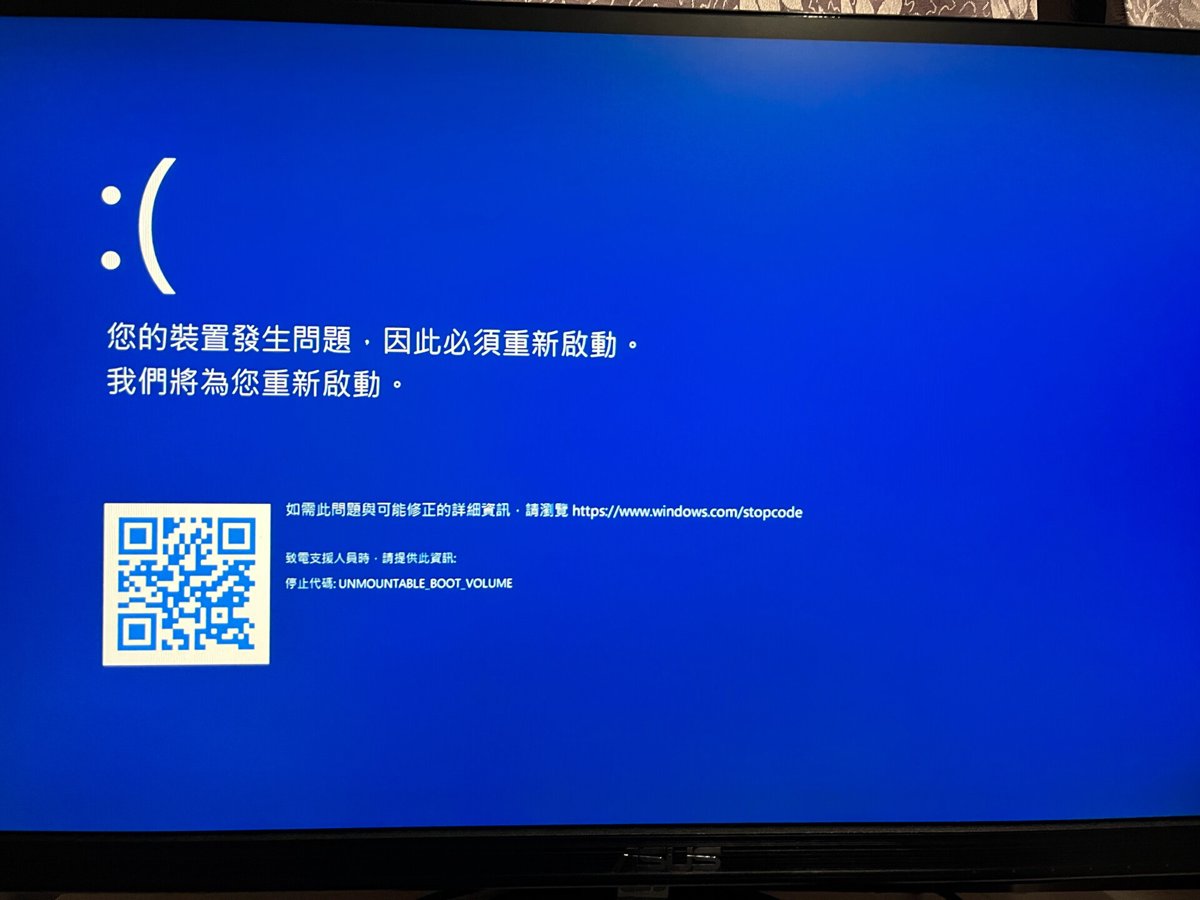
Every system has bugs. Someone will always try to poke them.
The operating system must therefore keep a program failure within its process and prevent unauthorized access to other processes' data or unlimited use of system resources. The kernel treats every process as potentially buggy or malicious and validates its requests accordingly.
What might a buggy or malicious process try to do? It might read another process's memory, but virtual memory limits each process to its own address space (Part 3). It might execute a privileged instruction, such as accessing a disk directly or disabling interrupts, but these operations require validated kernel services (Parts 2 and 4). Separate address spaces also keep memory corruption in one process from reaching the kernel or neighbouring processes (Part 3). A process cannot occupy the CPU indefinitely because periodic timer interrupts transfer control to the kernel, which schedules CPU time among runnable processes (Parts 5 and 6). Finally, the kernel tracks allocated memory and rejects requests that exceed configured limits, as discussed in a later week.
Why can't software enforce these protections by itself? Another program cannot intercept a privileged instruction before it executes because its checking code is not running at that moment. Protection therefore requires hardware support: the CPU restricts particular instructions and memory addresses according to a privileged mode bit. Part 2 examines that bit and then returns to the blue-screen example.
Part 2CPU modes: user mode and kernel mode
Every modern CPU provides at least two execution modes. In user mode, the CPU prohibits certain instructions and blocks access to protected memory regions. In kernel mode (also called supervisor mode), the CPU permits high-risk actions, such as talking to an I/O device. An I/O device (input/output device) is any piece of hardware outside the CPU and memory that the computer exchanges data with: the disk, the keyboard, the screen, the network card. Your programs normally run in user mode, whereas the kernel runs in kernel mode. The CPU tracks its current execution mode with a mode bit in a control register. The CPU sets it to 1 when processing a trap or interrupt and restores it to 0 when the kernel executes a special return instruction. Your program cannot modify the bit directly.
What exactly is forbidden in user mode?
The mode bit determines which instructions and memory regions the CPU permits. Most instructions and user memory remain accessible in both modes, whereas privileged instructions and the kernel portion of memory require a mode bit of 1.
If a program attempts a privileged operation: the CPU raises an exception instead of executing the operation. The kernel normally terminates the process. Linux then reports Segmentation fault or Illegal instruction.
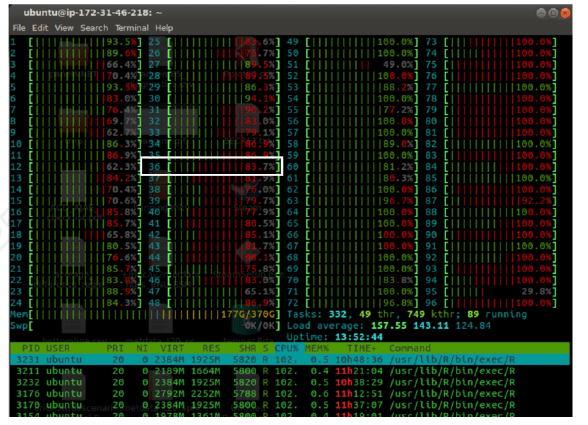
Run a command with time in front of it, and you will get three measurements:
$ time python3 -c "sum(range(10**7))"
real    0m0.31s      # wall-clock time
user    0m0.29s      # CPU time in user mode: Python adding numbers
sys     0m0.01s      # CPU time in kernel mode: loading Python, printing
user measures CPU time spent running your program in user mode, whereas sys measures CPU time spent running kernel services for it. A program that reads a large file may accumulate substantial sys time, a computation-intensive program accumulates substantial user time, and a sleeping program accumulates almost neither even though real time passes. In Part 9, you will produce all three cases.
Case study: a buggy driver and 8.5 million blue screens
In 2024, a widely used Windows antivirus software distributed a buggy update. About 8.5 million computers crashed and then crashed again after each reboot. Globally, 5,078 flights, or 4.6% of all flights scheduled that day, were cancelled.
The bug was an out-of-bounds memory read. In an ordinary user program, it would produce a Segmentation fault and terminate one process. However, this antivirus software ran in kernel mode. In kernel mode, a bug can bring down the whole computer.
Another famous horror story occurred during a Microsoft demo in 1998, when a newly connected USB scanner caused Windows to crash in front of thousands of audience. Bill Gates was very embarrassed: "That must be why we're not shipping Windows 98 yet." (。_。)

Answer
Each Chrome tab runs as a separate process in its own address space, so memory corruption in one tab cannot reach the others. It also runs in user mode, which allows the kernel to terminate the process and release its resources. On the other hand, a driver runs in kernel mode within the kernel's address space. A bug in the driver may therefore corrupt kernel tables or other critical state, and no higher-privilege component can isolate the failure. Rebooting the computer is the kernel's way to save itself from further damage.
Case study: why does a video game use kernel-mode software?
In 2020, Riot Games released an anti-cheat system called Vanguard together with Valorant (特戰英豪). Vanguard is installed as a kernel-mode driver and starts with Windows, not with the game. Many players were angry: OMG! This is a BACKDOOR!!! Why would a game need kernel mode? O口O
Answer: 以毒攻毒. Some cheating plugins (外掛) run in kernel mode, and nowadays a kid can write one with ChatGPT 👿. A user-mode program can only see what the kernel lets it see, so if a cheating plugin run in kernel mode, an anti-cheat software can't detect the cheat. To catch kernel-mode cheats, the anti-cheat must run in kernel mode too. BUT AS A RESULT, Vanguard has permission to read the memory of every process, not only the game's. Moreover, a bug in Vanguard can kill the whole computer.
The real question is how much kernel-mode code your system must trust. Security engineers call this code the trusted computing base (TCB): the components whose failure or compromise could undermine the security of the entire system. The kernel belongs to the TCB because it runs at the highest privilege level. Every kernel-mode driver adds more code to this base. A smaller TCB leaves fewer opportunities for a bug or attack to compromise the system. Secure designs therefore follow the principle of minimizing the TCB. The same reasoning led to the separation of the iPhone's functions among several small operating systems discussed in Week 2.
root the same as running in kernel mode?Answer
No. root is a user identity in the kernel's accounting system: a process with user ID 0. A root process still runs in user mode, requires system calls to open files, and cannot execute privileged instructions or access kernel memory directly. User ID 0 instead causes many kernel permission checks to authorize operations such as reading any file or terminating any process. Kernel mode is a CPU state, not a user identity. The kernel enters that state while serving both root and non-root processes.
Part 3The address space and the kernel mapping
On early systems, only one program ran at a time. The operating system occupied a small region at the bottom of physical memory, while the program used everything else, as shown in the left figure. When the program performed I/O, the CPU had to wait.
Recall the human-scale comparison from Worksheet 2: if one nanosecond were one second, a memory access would take 100 seconds, while one 4 KB disk read would take 28 hours. Letting the CPU idle for so long is a big waste!
Multiprogramming solved this problem by keeping several programs in memory. When one program waited for I/O, another could run. Time sharing extended this idea: instead of switching only when a program had to wait, the operating system divided CPU time into short intervals and switched regularly among runnable programs. Each program could then make progress without waiting for another program to finish. Because several programs share physical memory, the OS must enforce protection so that process A cannot read or modify process B's memory.
The address space: a program's view of memory
To make memory easier to use, every process receives the same simple, private view called an address space. It contains the regions your program needs while it runs:
- Code: the instructions, located at the bottom. Because their size does not change during execution, they can remain at a fixed location.
- Heap: memory allocated through
malloc(ornew). It begins above the code and grows upward as the program allocates more memory. - Stack: one frame for each active function call, containing local variables, arguments, and a return address. It begins at the top and grows downward with each call.
Placing the heap and stack at opposite ends allows both regions to expand into the free space between them. Other regions contain global variables, the C library, and the kernel.
Every process-visible address is virtual
Have you ever printed a pointer in C (see the C program below)? The number you see is a virtual address and it is different every time you run. Modern systems use address-space layout randomization (ASLR) to randomize the virtual locations of memory regions between runs. This makes it harder for attacker to perform memory attack.
// va.c
#include <stdio.h>
#include <stdlib.h>
int main(int argc, char *argv[]) {
    printf("location of code : %p\n", main);
    printf("location of heap : %p\n", malloc(100e6));
    int x = 3;
    printf("location of stack: %p\n", &x);
    return x;
}
$ gcc -o va va.c && ./va location of code : 0x5581d3a4a189 location of heap : 0x7f0a2c3ff010 location of stack: 0x7ffd1a5c9b6c # code < heap < stack, as in the figure # (a 100 MB malloc is placed by mmap, # so the heap value is higher than you # might expect; small mallocs are lower)
Function calls and the stack
Let's take a look at how the stack looks like when I call meow(3) recursively:
// meow.c
void meow(int n) {
    if (n > 0) meow(n - 1);  // call myself
    else printf("meow");
}
int main(void) {
    meow(3);
    return 0;
}Each call pushes a frame: the argument n, space for local variables, and the return address, the place in the caller to continue from. Each return pops the top frame and jumps to that address. The stack pointer register always marks the top frame. A call costs about a nanosecond, and it never leaves the process's own memory or user mode. A function call changes the stack pointer and the program counter, and nothing else: not the mode bit, not the address space. Keep that in mind, because Part 4 shows what a system call has to change in addition.
The kernel mapping at the top of every address space
The upper part of every process's address space is mapped to the kernel. This region contains kernel code, kernel data such as the process table, and a small private kernel stack. A user program cannot read or write this region because the page table marks its pages as kernel-only, and the CPU blocks their access while the mode bit is 0.
Why map the kernel into every process instead of giving it a separate address space? The reason is speed. Because the active page table already contains the kernel mapping, the CPU can begin executing the handler without first changing address spaces. This design reduces a system call from several thousand nanoseconds to a few hundred nanoseconds. However, it depends on hardware correctly enforcing the kernel-only permission bit that prevents user-mode access to kernel memory.
Answer
Because the kernel is usually in the middle of work for several processes at once. Process A may be asleep inside read(), waiting for a key (walkthrough 3), while the timer has just interrupted process B (walkthrough 2). Each of them has state saved inside the kernel that must survive until it runs again. With one shared stack, B's state would overwrite A's. So every process gets its own small kernel stack, and switching process also means switching kernel stack.
Part 4System calls and function calls
Recall from Week 2 that printf is a libc function that transparently buffers your output, so that many small prints become one call into the kernel. Where do the bytes go when that call happens? printf cannot touch the screen itself: the screen is an I/O device, and user mode may not talk to I/O devices. So it asks the kernel, through the write system call. A system call is how a program asks the kernel to do something on its behalf.
Why not simply call the kernel's function?
The kernel has a function that writes to the screen, sys_write, and Part 3 showed that the kernel's code is mapped into the top of your process's address space. So why can't printf just call sys_write like any other function? Because a function call changes only the program counter. The CPU would still be in user mode, and in user mode sys_write cannot run because its pages are in kernel space The mode bit has to change too.
Only the hardware can flip the mode bit. For this, the CPU provides one special instruction, the trap instruction, which switches the CPU to kernel mode and jumps into the kernel. The CPU always jumps to one fixed entry point that the kernel set up when it booted. The program only passes a number that names the service it wants, such as "write".
The calling convention
Here is what happens when your program calls write(1, "meow", 4). A short assembly wrapper in the C library prepares these register values (we call the registers R1 to R4; every CPU has its own names for them, on x86-64 they are rax, rdi, rsi, rdx):
| register | value | meaning |
|---|---|---|
R1 |
1 |
the system call number of write (0 is read, 1 write, 2 open, 3 close, 39 getpid, 57 fork, 59 execve, …) |
R2 |
1 |
first argument: file descriptor 1, stdout |
R3 |
0x4006a0 |
second argument: the address of the string, not the string |
R4 |
4 |
third argument: how many bytes |
then the syscall instruction; on return, the result (or a negative error code) is in R1 |
||
Early Unix had approximately twenty system calls. Linux on x86-64 now has more than 300 (a searchable table), all of which use the same controlled kernel-entry mechanism.
Here is the five step in a system call.
- program The C library's wrapper puts the service number in
R1and the arguments inR2toR4, then executes the trap instruction. - hardware The CPU saves the program's registers and program counter on the process's kernel stack, sets the mode bit to 1, and jumps to the kernel's entry point, the address it was given at boot.
- kernel The kernel reads the number and checks the arguments. Arguments that are strings or arrays arrive as pointers into user memory, so the kernel copies that data into its own memory before using it, and later copies any result (the bytes of a
read) back out. Then it does the privileged work. - hardware On return-from-trap, the CPU restores the saved registers with the result in
R1, sets the mode bit back to 0, and continues at the instruction after the trap. - program The wrapper checks
R1: a negative value becomeserrnoand a return value of −1. Your program should check that too (Part 8).
printf("meow") to terminal output and back.
Open walkthrough 1 ▶ 12 steps · use ← → keys · press E for the explanation
A system call is very different from a function call!
A system call may look like a normal function call: result = syscall(arguments). But they behave very differently.
A function call jumps to a function address chosen by the program, while a system call enters the kernel through a predefined entry point. A function call stays in user mode, while a system call switches the CPU into kernel mode and later returns to user mode. A function call continues using the user stack, while the kernel executes on a separate kernel stack. This is also why system calls like read() and write() that send or receive array or strings requires explicit deep copy between user and kernel stack.
A normal function call is cheap, while a system call is much more expensive because it requires a privilege transition and additional kernel bookkeeping. This is one reason libc buffers operations such as printf() instead of issuing a system call for every character.
Argument validation at the privilege boundary
Let's take a closer look at walkthrough 1, step 6. A CPU register can only hold small value, so larger objects such as strings and arrays are passed as pointers.
For example, R3 = 0x4006a0 gives the address of "meow", rather than the text itself.
Before using the string, the kernel copies the four bytes from user memory into its own memory. Data moving in the opposite direction follows the same pattern: read copies its result from kernel memory into the user's buffer.
This copying also gives the kernel an opportunity to validate the memory being accessed. Suppose a malicious program passes R3 = 0xffff880000001000, an address in the kernel region. Because the system call handler runs in kernel mode, it could read from that address.
If write accepted the pointer without checking it, it could print the data in kernel memory, potentially exposing data belonging to other processes. To prevent this, sys_write verifies that the entire buffer range lies in user space before accessing it. Every system call argument must be validated at the user-kernel boundary, because this is the point at which untrusted input gains access to privileged operations.
Horror story: a backdoor hidden in an argument check
On 5 November 2003, Larry McVoy noticed a weird change to the argument checking of the wait4 system call in the Linux kernel source code:
if ((options == (__WCLONE|__WALL)) && (current->uid = 0))
    retval = -EINVAL;
Look closely at the second condition: current->uid = 0 contains a single =. The expression does not compare the user ID with 0; it sets the ID to 0. Any program that called wait4 with this invalid combination of flags would therefore have acquired root privileges. Its placement within an input check made the change look like ordinary validation code. Fortunately, this malicious change was caught within a day by the kernel maintainer.
Part 5CPU exceptions
A system call is only one of four ways for execution to enter the kernel. More generally, an exception is an event that interrupts the CPU's normal instruction sequence, switches execution to kernel mode, and transfers control to a kernel handler specified by the trap table. Exceptions fall into four categories, based on what causes them and how execution proceeds afterward.
Who caused it, the running program or the outside world? Was it expected, or did something go wrong?
running program
The program asks for the kernel on purpose, with one instruction.
→ continue at the next instruction
a system call · a breakpoint set by gdb
An instruction went wrong by accident.
→ the kernel fixes it and retries the same instruction, or kills the process
page fault (fixed) · divide by zero, bad address, privileged instruction in user mode (killed)
outside world
An I/O device wants attention. Nothing to do with the program that happens to be running.
→ continue at the next instruction of whoever was running
a key press · a timer tick · the disk has finished · a network packet
The hardware reports damage the kernel cannot trust itself to survive.
→ nothing safe is left to do: kernel panic
an uncorrectable memory error · a machine check · a corrupted kernel structure
In summary, a program deliberately issues a trap, an instruction unintentionally causes a fault, an I/O device generates an interrupt, and hardware damage or inconsistent state causes an abort.
Exercise: which kind of exception is it?
Click each event to check your answer. Ask yourself two things: who caused it, and what happens afterwards.
A fault can be ok
A fault might sound terrible, but it is often normal. Recall the page fault from Week 2 walkthrough 2: the first time your program writes to a page obtained through malloc, it may fault because no physical page has yet been mapped. The kernel maps a new page and re-executes the same instruction, so your program continues without a visible failure. A fault becomes a Segmentation fault only when the referenced address is outside of a valid region.
Part 6Time sharing: the timer interrupt and the context switch
How can one CPU run many processes at nearly native speed while the operating system stays in control? The mechanism is called limited direct execution.
Direct execution, and its two problems
The fastest way to run a program is also the simplest: load it into memory, jump to main(), and let it run on the CPU at full speed. This is called direct execution, and it is what every kernel does. It raises two problems. The first you have already seen: what if the program does something it should not, such as talking to the disk directly? Part 2 and Part 4 answered that: the program runs in user mode and must trap into the kernel for privileged work.
The second problem is more tricky. While your program is running, the kernel is not running. The kernel is only code; it can do nothing unless it is on the CPU. So how does it ever get the CPU back, to give another program a turn?
The cooperative approach: wait for the process to yield
Early systems relied on programs to hand the CPU back voluntarily: every system call gives the kernel a chance to run, and a polite long-running program calls a yield() system call now and then just to let another process run. This is called cooperative scheduling.
But what if a program never hands the CPU back? An infinite loop with no system call in it, whether from a bug or from a bad boy, occupies the CPU forever. No kernel code can run, so the whole machine hangs, and rebooting is the only remedy.
The non-cooperative answer: the timer interrupt
The solution is a hardware timer that raises an interrupt every few milliseconds independently of the running program. Each of these periodic interrupts is called a tick; Linux is usually configured for 250 or 1,000 ticks per second. When a tick occurs, the CPU saves the program's registers, changes to kernel mode, and transfers control to the timer handler identified by the trap table, as it does for other exceptions. The kernel can then continue the current process or select another one. This is called preemptive scheduling.
Thanks to the timer, the kernel always takes back the CPU from an user process within a millisecond. Each time the kernel decides: let the same process continue? or switch to another process? To switch processes, the kernel saves the running process's registers so that the process can later resume exactly where it stopped, and loads the registers of the next one. This is called the context switch.
Isn't it wasteful to interrupt the CPU a thousand times a second? Consider a 3.4 GHz Intel Core i5. A timer interrupt arriving 1,000 times per second leaves about one millisecond, or 3.4 million clock cycles, between two ticks. Handling a tick, including saving the registers, running the handler, and returning, might take about a microsecond. That is only about one thousandth of the interval between ticks.

Keyboard interrupts are rarer still. The fastest typist in the world manages about 216 words per minute, roughly 18 keystrokes per second. Even at that speed, a keyboard interrupt arrives only once every 55 milliseconds, leaving about 190 million clock cycles between keystrokes.
To get a better sense of these time scales, let's stretch them to human time. Suppose handling one interrupt took one minute. On the same scale, the next timer tick would arrive 1,000 minutes later, about 17 hours. The next keystroke from the world's fastest typist would arrive 55,000 minutes later, about 38 days. From the CPU's point of view, even a thousand interrupts per second are relatively infrequent and inexpensive events. Timer-driven time sharing therefore consumes only a small fraction of the machine's execution time, while preventing any single program from keeping the CPU indefinitely.
The context, and where it is kept: the PCB
To stop a process now and continue it later, the kernel must remember the process's CPU states, including the values of its registers, its program counter, its stack pointer. These states are called the process's context. The kernel keeps the context in the process's process control block (PCB). A context switch is the kernel saving one process's context into its PCB and loading another's out of it. Because the switched-out process's context is kept exactly, and its memory is untouched, it resumes later precisely where it stopped, unaware that it was ever away. ٩(^ᴗ^)۶
Fast and slow system calls
A timer tick is not the only reason to switch processes. Think about what a system call asks for. Some requests the kernel can answer at once: what is my process ID, what time is it. This is called the fast system call. Others depend on the outside world: a keystroke that has not been typed yet, a disk block that is still on its way, a child process that has not exited. This is called the slow system call. When a slow system call is invoked, the kernel has nothing to return yet. Letting the process spin on the CPU while it waits would waste CPU. Instead, the kernel puts the waiting process to sleep and runs another process instead.
getpid(): read a field of the PCB.gettimeofday(): read the clock.getuid(): read the user ID.- Trap in, do a few instructions, trap out. A few hundred nanoseconds.
read()from a keyboard, a pipe, a network socket, or a disk block that is not cached.write()to a full pipe or a slow I/O device.wait()for a child that has not exited yet (bash in Week 3).- The kernel marks the process as sleeping, places it on a wait queue, and switches to another process. A sleeping process consumes no CPU time.
A slow system call therefore ends the process's turn on the CPU just as a timer tick does, except that the process itself is giving the CPU up.
read() to the character stored in a variable.
Open walkthrough 3 ▶ 13 steps
while (1);. What happens to the other programs under cooperative scheduling? And on Linux?Answer
Under cooperative scheduling, the loop never issues a system call, so kernel code does not run again. Every other program remains unresponsive until the machine is reset. On Linux, a timer interrupt occurs within a millisecond, after which the kernel's scheduler can select another ready process. The loop therefore consumes only its scheduled share of CPU time, or one full core when no other process is ready, and it can be terminated from another window.
getpid() cause a context switch?Answer
No. It traps into the kernel and returns directly to the same process. A mode switch is not a context switch.
read() on the keyboard cause a context switch when no key has been pressed?Answer
Yes. There is nothing to return, so the process sleeps, and the kernel's scheduler selects another process to run.
Answer
No. The timer handler runs and returns to the same process, because there is no other process to switch to. A tick may cause a context switch, but it does not always do so.
Part 7vDSO: avoiding selected system calls
A function call costs about a nanosecond; a system call costs a few hundred, before it does any work, because of the trip through the trap and back. Usually that is a fair price for a privileged service. But think about how often software checks the time. A database obtains a timestamp for every query, and a web server records the time for every request. On a busy machine, gettimeofday() and clock_gettime() may therefore execute millions of times per second. If each invocation used a trap, reading one value would incur several hundred nanoseconds of user-kernel transition overhead.
Do we really need a trap just to read the clock? Yes! Linux avoids the transition cost by mapping a small read-only page containing the current time and a small library that reads it into every process's address space. This library is the vDSO (virtual dynamic shared object). When your program calls gettimeofday(), libc invokes the vDSO function, which reads the shared page and returns. The operation therefore becomes an ordinary function call with no trap or mode switch.
gettimeofday() as a real system call (ARM64, 2016)The vDSO appears beside the stack and heap in a process's memory map:
$ grep -E "vdso|vvar|stack|heap" /proc/self/maps
5581d3c6a000-5581d3c8b000 rw-p 00000000 00:00 0    [heap]
7ffd1a5aa000-7ffd1a5cb000 rw-p 00000000 00:00 0    [stack]
7ffd1a5f2000-7ffd1a5f6000 r--p 00000000 00:00 0    [vvar]   # the kernel's read-only data page
7ffd1a5f6000-7ffd1a5f8000 r-xp 00000000 00:00 0    [vdso]   # the kernel's small library
Optional reading: vDSO fallback on AWS (2017), when the shortcut silently disappears
Goes beyond what the quiz asks. Read it if you are curious what happens when the vDSO cannot do its job and every call to read the clock quietly becomes a real system call again.
In 2017, packagecloud engineers observed that gettimeofday() ran 77% more slowly in a loop of 500 million calls on their Amazon EC2 virtual machines than on their own hardware, although their code had not changed. strace identified the relevant difference: the calls did not appear on their laptops because vDSO calls do not enter the kernel, whereas every invocation appeared as a system call on EC2.
Those EC2 machines used a Xen hypervisor clock that the vDSO code could not read from user mode. The implementation therefore fell back to a trap. Despite using the same program, libc, and kernel version, every time query on EC2 incurred the cost of a mode switch. The measured vDSO benefit corresponds to the user-kernel transition cost. When the vDSO path is unavailable, the operation retains that cost.
Optional reading: Meltdown (2018), when the hardware broke the promise
Goes beyond what the quiz asks. Read it if you are curious how the kernel-in-every-address-space trick from Part 3 was attacked, and what fixing it cost.

In January 2018, researchers disclosed Meltdown. Modern CPUs may execute instructions speculatively before completing permission checks. On most Intel CPUs of the period, a user program could issue a load from a kernel address. The CPU eventually cancelled the load and raised an exception, but the value had already changed the cache state, which the program could measure through a side channel. Consequently, a user-mode program could read kernel memory at a rate of a few kilobytes per second without issuing a system call. Because the kernel maps physical memory, the exposed data could include other processes' passwords and cryptographic keys.
The mitigation, called KPTI (kernel page-table isolation), removes nearly all kernel mappings from the user page table, retains only a small trampoline, and switches page tables on every trap. This change slowed programs that issue many system calls: the effect was a few percent for a typical database and substantially greater for workloads with especially high system-call rates. Newer CPUs corrected the hardware behavior, allowing the shared mapping to be used again.
The key trade-off is now clear: mapping the kernel into every address space improves performance, but its security depends on correct hardware enforcement of kernel-only pages. When that enforcement failed under speculative execution, software isolation restored the protection at an additional execution cost.
getpid() a vDSO call too? What about read()?Answer
getpid(): yes, in principle. glibc once cached the PID in user space but discontinued the approach because the cache became incorrect after fork in unusual cases. Because the PID is public and does not change within a process, a read-only page could contain it. read(): no. It may require I/O device access, which is restricted to kernel mode; it may block, which requires kernel scheduling; and its result depends on the calling process's file descriptor table, which is maintained in kernel space. The vDSO applies only to calls that read public, kernel-maintained data without other privileged operations.
Part 8Two habits of a system programmer
The mechanisms above suggest two habits worth carrying into systems programming. Sometimes you will build a platform that other programs depend on. At other times, your program will depend on a platform provided by someone else. These two sides of the boundary come with different responsibilities.
Habit 1 for platform providers: validate every untrusted input
When you provide a service to code you do not control, treat every input as untrusted. The caller may contain a bug, or it may deliberately try to misuse your interface. The Linux kernel follows this principle when validating arguments passed through system calls, but the same idea appears throughout system software. A browser, for example, runs a web page's JavaScript inside a sandboxed renderer process so that a malicious page cannot freely access the rest of the machine. A database check user input carefully to prevent SQL injection. If you provide the platform, never assume that the caller will use your interface correctly.
Habit 2 for platform users: assume every system call can fail
When your program relies on the operating system, do not assume that every request will succeed. A file may not exist, your process may lack permission, memory may be unavailable, or a signal may interrupt an operation. If you ignore these failures, the program may continue with invalid assumptions and produce errors much later, making the original problem difficult to find.
On Unix-like systems, many system calls report failure by returning −1 and setting errno to indicate the reason. The function perror() prints a description of the current errno value. If you use the platform, check what it tells you before assuming that an operation succeeded.
char *buf;
if ((buf = malloc(size)) == NULL) {
    perror("malloc");          /* prints "malloc: Cannot allocate memory" */
    exit(1);
}
int fd;
if ((fd = open("/hey", O_RDONLY)) == -1) {
    perror("open(/hey)");       /* prints "open(/hey): No such file or directory" */
    return -1;
}
The following table lists common errno values from errno.h:
| errno | perror output |
Typical cause |
|---|---|---|
ENOENT |
No such file or directory | typo in the path? |
EACCES |
Permission denied | you don't have the correct permission to access the file |
EFAULT |
Bad address | you passed an invalid pointer to the kernel (Part 4) |
ENOMEM |
Cannot allocate memory | the memory might be full |
int fd = open("config.txt", O_RDONLY);
read(fd, buf, 100);
printf("config: %s\n", buf);
Answer
Suppose config.txt is missing. open returns −1 and sets errno = ENOENT, but the program does not check the result. It then calls read(-1, …), which fails with EBADF and returns −1 without modifying buf. That result is ignored too. Finally, printf reads uninitialized data from buf and may print indeterminate output or crash if no terminating zero occurs in accessible memory. From the user's perspective, the output gives no indication that a missing file caused the failure. Check both calls, and use the return value of read to determine how many bytes in the buffer are valid.
Part 9Practice in the terminal
All the C programs below are in the exercise repository sys-nthu/os26-w4; its file names start with the exercise number, so 03-segv.c belongs to exercise 3.

Run ./setup.sh to install the software dependencies, then run make to build everything.
- Compare user, system, and elapsed time. Run these three commands and compare the
userandsyslines:$ time python3 -c "sum(range(10**7))" # computing: user mode $ time dd if=/dev/zero of=/dev/null bs=1 count=1000000 # two million system calls: kernel mode $ time sleep 1 # asleep: neither
Why doessleep 1report almost zerouserandsysbut one second ofreal? - Observe the trap.
02-meow.cis the program below. Run it understrace. Count thewritecalls. Then runstrace -c lsto obtain a summary table of the system calls issued byls.// meow.c #include <stdio.h> int main(void) { printf("meow"); printf("meow"); printf("meow\n"); return 0; }$ strace ./02-meow 2>&1 | grep -E "write|exit" - Generate a fault and inspect its status. Run
03-segv, which writes to address 0 (*(int*)0 = 1;), and03-fpe, which divides by zero (return 10 / (argc - 1);with no arguments), then print$?. The expected values are 139 and 136. Verify that 139 − 128 = 11 =SIGSEGVand 136 − 128 = 8 =SIGFPE.$ ./03-segv; echo $? Segmentation fault (core dumped) 139 $ ./03-fpe; echo $?
- A privileged instruction from user mode.
hltstops the CPU until the next interrupt. An idle core may execute it in kernel mode, but its execution in user mode raises an exception.04-hlt.cexecutes it with__asm__ volatile("hlt");. Predict the message, then run:$ ./04-hlt; echo $?The CPU raised a general protection fault, which Linux converted to the same signal used for an invalid address. Which of the four exception types is this? - Count the interrupts.
/proc/interruptshas one line per interrupt source with a counter per CPU. Look at theLOCline (the local timer) twice, one second apart. Then watchvmstat, whoseincolumn is interrupts per second andcsis context switches per second, and start a busy process in the middle:$ grep -E "LOC|^ +CPU" /proc/interrupts $ sleep 1; grep LOC /proc/interrupts $ vmstat 1 5 $ yes > /dev/null & $ vmstat 1 5; kill %1
Do you observe 1,000 ticks per second on each CPU? The count may be lower because a "tickless" kernel disables the timer on an idle core. Why doesyesincrease thecsvalue? - Every address is virtual: run it twice.
06-va.cis theva.cprogram from Part 3. Run it twice and compare the two outputs:$ ./06-va $ ./06-va
Confirm code < heap < stack in both runs. Why are all three addresses different the second time, although the program did not change? Which region moved the most? - Locate the vDSO mapping. Locate the vDSO in your shell's memory map and verify that the time functions do not trap:
$ grep -E "vdso|vvar|vsyscall|heap|stack" /proc/$$/maps
$ strace -e trace=gettimeofday,clock_gettime date
# only the date is printed: no call was traced,
# because the time functions never reached the kernel
If present, the[vsyscall]line appears atffffffffff600000, an address in the kernel portion of the address space. This mapping predates the vDSO. - Optional: measure the boundary-crossing cost.
08-cost.cruns two loops: one callssyscall(SYS_getpid)one million times, thereby bypassing libc and always trapping, and the other callsgettimeofday()one million times, which the vDSO answers without a trap. Each loop is timed withclock_gettime(CLOCK_MONOTONIC, …)and the program prints nanoseconds per call. Run./08-costand read the code: how big is the gap on your machine?
Self-checkLearning goals
Check each item that you can complete without consulting the worksheet. The Oct. 7 quiz covers these topics. (Progress is stored only in this browser.)
AttributionCredits
- The course illustrations of Nini are NTHU CS Operating Systems course material (Tony Chen / Yun-Chih Chen), licensed under CC BY 4.0. The cat art is from Freepik and ChatGPT. The htop screenshot and the redrawn diagrams (CPU modes, the kernel half of the address space, time sharing, the slow system call) are from the lecture slides Exception: Syscall & Context Switch; the memory-layout figures on those slides follow Bryant and O'Hallaron, Computer Systems: A Programmer's Perspective.
- Parts 3 and 6 draw on, in the worksheet's own words and figures, chapters 13 (The Abstraction: Address Spaces) and 6 (Mechanism: Limited Direct Execution) of Arpaci-Dusseau and Arpaci-Dusseau, Operating Systems: Three Easy Pieces.
- The Chrome "Aw, Snap!" screenshot is by Neelkamala, BSD licence, via Wikimedia Commons. The DSKY photograph is by NASA, public domain, via Wikimedia Commons. The Meltdown logo is by Natascha Eibl, CC0, from meltdownattack.com. The typing cat GIF is from Tenor. The Windows 10 blue screen photo is from a Bahamut forum post (January 2023). The embedded COMDEX video is "Windows 98 blue screen crash live at COMDEX 1998" on YouTube.
- Case-study sources: the 2024 Windows outage, Wikipedia (flight and device counts) and Microsoft's Windows Resiliency Initiative announcements (2024, 2025); Riot Vanguard, PC Gamer; Meltdown, Lipp et al., 2018 and Brendan Gregg's KPTI measurements; the 2003 backdoor attempt, LWN; Apollo 11, the Apollo Lunar Surface Journal and Don Eyles, Tales from the Lunar Module Guidance Computer; the vDSO numbers, the Linux Plumbers Conference 2016 talk cited on the slide and packagecloud's EC2 investigation (2017);
vdso(7)andproc_pid_status(5)man pages. - See
images/CREDITS.mdfor the complete list of image sizes and sources.

